Visualizing Complex Data with Embedded Plots
- Visualizing Complex Data with Embedded Plots.
- Journal of Computational and Graphical Statistics, vol. 24, no. 1, pp. 26––43, 2015.
Download: pre-print
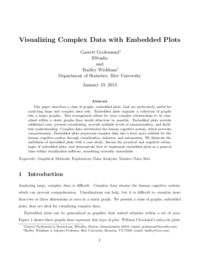
This paper describes a class of graphs, embedded plots, that are particularly useful for analyzing large and complex data sets. Embedded plots organize a collection of graphs into a larger graphic. This arrangement allows for more complex relationships to be visualized within a static graphs than would otherwise be possible. Embedded plots provide additional axes, prevent overplotting, provide multiple levels of summarization, and facilitate understanding. Complex data overwhelms the human cognitive system, which prevents comprehension. Embedded plots preprocess complex data into a form more suitable for the human cognitive system through visualization, isolation, and automation. We illustrate the usefulness of embedded plots with a case study, discuss the practical and cognitive advantages of embedded plots, and demonstrate how to implement embedded plots as a general class within visualization software, something currently unavailable.
@Article{embedded-plots,
  author = {Garrett Grolemund and Hadley Wickham},
  journal = {Journal of Computational and Graphical Statistics},
  number = {1},
  pages = {26––43},
  title = {Visualizing Complex Data with Embedded Plots},
  volume = {24},
  year = {2015},
}