Product plots
- Product plots.
- IEEE Transactions on Visualization and Computer Graphics (Proc. InfoVis '11), vol. 17, no. 12, pp. 2223–2230, 2011.
Download: pre-print
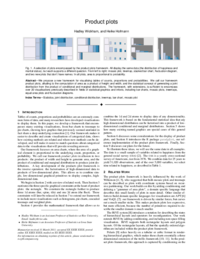
We propose a new framework for visualising tables of counts, proportions and probabilities. We call our framework product plots, alluding to the computation of area as a product of height and width, and the statistical concept of generating a joint distribution from the product of conditional and marginal distributions. The framework, with extensions, is sufficient to encompass over 20 visualisations previously described in fields of statistical graphics and infovis, including bar charts, mosaic plots, treemaps, equal area plots and fluctuation diagrams.
@Article{prodplots,
  author = {Hadley Wickham and Heike Hofmann},
  journal = {IEEE Transactions on Visualization and Computer Graphics (Proc. InfoVis '11)},
  title = {Product plots},
  year = {2011},
  number = {12},
  pages = {2223–2230},
  volume = {17},
}