A constraint-based layout approach to data visualization
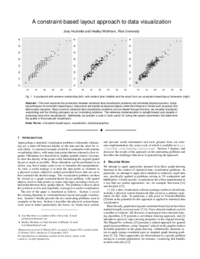
This work explores the connection between statistical data visualization problems and simulated physical systems. Apply- ing techniques for constraint-based layout, data points are treated as physical objects under the influence of forces such as gravity and electrostatic repulsion. Many common statistical data visualization problems can be viewed through this lens; we consider scatterplot overplotting and the Dorling cartogram as our motivating problems. The reference implementation is straightforward and capable of producing instructive visualizations. Additionally, we present a suite of tools useful for tuning the system parameters that determine the quality of the produced visualization.
@TechReport{constrained-layout,
  author = {Joey Huchette and Hadley Wickham},
  institution = {had.co.nz},
  title = {A constraint-based layout approach to data visualization},
  year = {2013},
}
